Speed, Glorious Speed
Sometimes I think half of game development is optimization. And with J2ME's typically limited CPU and RAM capabilities, it's even more important to squeeze as much as you can out of the devices. Depending on how you approach itand whether a deadline is loomingoptimizing code can be fun or frustrating. However, there is nothing quite like seeing your game's performance jump as you track down and eliminate the weak points in your code.
When to Optimize
I have a friend who is what you might call an "academic" programmer. He typically works on large-scale simulation systems (predicting little things like the motion of planets around a black hole). A few years ago he decided to try his hand at game programming. The work required the creation of a physics simulation of a dirt-racing bike. Being an expert in mathematical dynamics, he spent three months developing probably the best physics simulation I've ever seen. It was damn near perfect. Unfortunatelyyep, you guessed itthat sports racing bike ran like a 30-year-old scooter. You couldn't measure performance in frames per second because it wasn't quick enough to get through a single frame! When fully integrated with the game, the poor performance dragged down the entire system. We ended up fixing it, but not without effectively starting from scratch. The end result was nowhere near as realistic, but it was a lot more fun to play.
The important point of this story is that optimization is an ongoing process, both in code direction and in the development process. You need to approach things with a realistic idea of the speed of your code. As you go, you need to keep a constant watch on the effect your code is having on the performance of the game. This means you should integrate features into the full game early and continually test the effects of your code on the game's overall performanceunlike my friend. If you're developing something you've never done before, it's even more important to keep a close eye on the effects of your code.
Having said that, I should also point out that optimization can be your enemy. Excessive or early optimization of your code can waste time and, believe it or not, introduce bugs. When you develop new code you have to be conscious of your game's overall performance, but you shouldn't go so far as to fine-tuning every bit of code. Concentrate on getting the functionality of your game going first, making sure your code runs well at a reasonable frame rate. Leave the intensive performance tweaking for later in the project.
Leaving extreme optimizing until later in the development cycle also means you don't waste time optimizing something that might not make it into your game. It's quite common to throw out parts as you come up against resource limitations (or just because an aspect doesn't work well), so you don't want to waste too much time optimizing it. This will happen more often than you think when you face the reality of J2ME JAR size limits.
Don't Optimize Blindly
This brings me to probably the most important aspect of optimization. Don't optimize code you think is slow; optimize what you know is slow. It amazes me how often I still make the mistake of thinking a part of my code is slow when in fact it's hardly affecting things at all.
In a similar vein, I've written plenty of code I thought was fast only to find out, after profiling, that it was a one-way ticket to Dogville. This is the trap of blind optimization. Get your code to work (and by all means make it work well), but before you go seriously out of your way to optimize things, spend some time figuring out where the real performance problems are.
So how do you go about doing this? Wouldn't it be great if you could get a report on the performance of your code? Imagine seeing (in percentage terms) how much time is spent in any given part of your game. The good news is, you can! Enter the method profiler....
Method Profiling
Profiling involves tracking the memory and CPU usage of every part of your code while it's executing. You can then review exactly where things are slow (rather than where you think they're slow). Thankfully, Sun integrated profiling directly into the J2ME JVM, so you don't need to use a third-party profiling tool to get results. Sun's Wireless Toolkit includes an interface to the JVM's profiling output, which makes working with the profiling results a breeze.
To profile your game, use the Toolkit's Preferences tool to enable profiling, and then run the game with the Sun emulator (see Figure 15.1).
Figure 15.1. Enabling profiling using the default emulator
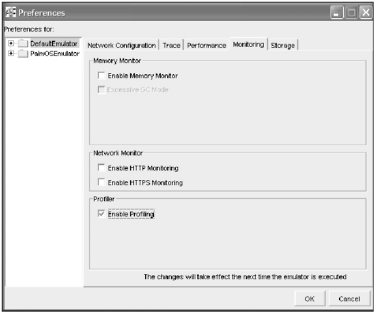
When you run your game you won't see anything regarding the profiler. It works away in the background, calculating the performance of your code. Once you exit your MIDlet, you'll see a performance report similar to Figure 15.2.
Figure 15.2. Sample results from a profiling session
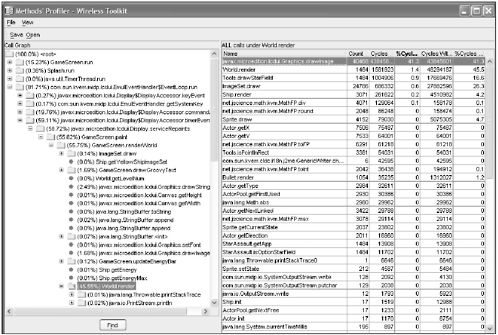
The profiling report contains two windows. On the left is the Call Graph pane, showing a hierarchy of all the method calls in your application. You can select the top node, <root>, to display all the method calls. The percentage number for each entry is the relative amount of time the application spent executing that method and all its children (methods called by that method). If you take a look at the example report, you can see that the game spent 81 percent of its time executing the EventLoop.run method. This is the primary game thread for the Sun emulator, so it's no surprise you spent the most time there. In Figure 15.2 you can see I've opened up this method to see what's going on in more detail.
NOTE
Tip
Profiling works by measuring the performance of code that executes while it's running. If you're trying to improve the performance of a particular area of the code, such as the world rendering, then try to get lots of things on the screen to really push the code's workload.
NOTE
Note
When you're reviewing performance results, you'll see many stats listed as either including or excluding children or descendants. A child method is any call made to a method from within another method. For example, if method a calls methods b and c, then the performance results excluding children would represent only the code within method a, not anything within b or c (nor any methods those methods would then call). Results that include children represent the performance all the way through the descendant calls.
On the right side is a detailed list of the methods called for the current Call Graph selection. I've selected the World.render method, so the right side is showing all of the calls made from this method. For each of these methods you can also see
Count. The number of times this method was called.
Cycles. The actual time spent executing this method (excluding children).
%Cycles. The percentage of total execution time (excluding children).
Cycles with Children. The execution time for this method (including children).
%Cycles with Children. The percentage of total execution time for the selected method (including children).
NOTE
Tip
You need to turn off obfuscation before running the profiler or all of your method names will be meaningless. You can do this by editing the build.xml file and commenting out the obfuscate="true" line in the wtkpackage task.
You can reorder the method list by clicking on the heading of the column. If you do this using the %Cycles with Children column, you can see that most of the time in this method is spent in calls to DrawImage. From here, you can look further into what and where you call this method to see whether it's possible to reduce the number of calls. For example, you could cut back on the total number of images drawn on the screen each cycle.
Feel free to browse around, looking at other performance results. Profiling is a little like a murder mystery; you need to analyze all the clues to find the real culprit. (Maybe it was the butler method in the DiningRoom class.)
Now that you've seen how to gather information on your code, take a look at the other side of the equationmemory management.
Memory Profiling
Most programmers don't rate memory profiling as a significant optimization technique. (It always takes a backseat to method profiling.) With Java, and especially J2ME, the amount of memory you use is more important than you think. Object creation is very slow, the heap is limited, and garbage collection can seriously degrade performance if it has to run too often (in order to clean up your objects). Thankfully, the Toolkit provides a great tool for profiling the memory habits of your gamethe memory monitor.
You can enable the memory monitor similar to the way you used the profiler. Select it using the Toolkit Preferences, and then rerun your application (see Figure 15.3). I recommend you don't run both the profiler and the memory monitor at the same time because it will degrade the performance of your game too much.
Figure 15.3. Enable the memory monitor using the default emulator preferences.
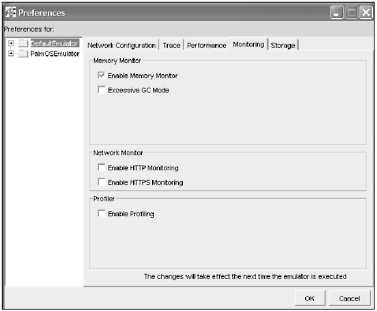
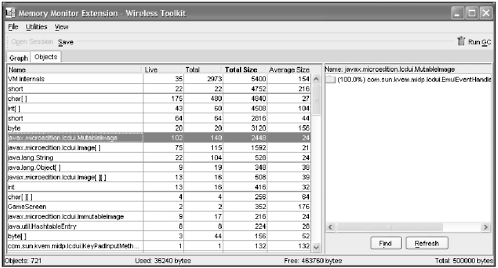
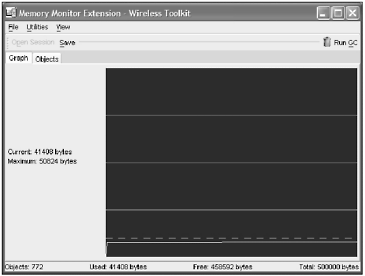
Unlike the profiler, the memory monitor displays a status screen as soon as you start the emulator. You can see an example of it in Figure 15.4. On this panel, you can track the type and number of objects as your code creates them. This is useful for tracking down when and where you're using memory excessively. Feel free to run other games using the monitor and see when and where they create similar objects.
Figure 15.4. Sample output from the memory monitor
NOTE
Tip
The memory profiler (as with most heap profiling) is very slow under J2ME. Be prepared to wait quite a while for applications to start.
The memory monitor also shows you a cool little graph of the state of the heap (see Figure 15.5). Use this to keep track visually of how your game is using memory as it progresses. Watch especially for any time where memory exceeds the currently allocated heap (the dotted red line).
Figure 15.5. The memory monitor graph shows memory usage in real time (with pretty colors too!).
Garbage Monitoring
Java relieves you of the burden of having to manually clean up your objects when they are no longer in use. It does this by maintaining a reference count of all the objects you create. The garbage collection (GC) process runs periodically in the background, checking to see when this reference count falls to zero. When it does, the GC clears the object.
The process of cleaning up objects is normally very fast (hardly noticeable on a well-tuned application); however, if the object creation count begins to climb, the garbage collector will have to do more work to clear out old objects. This can quickly lead to serious drag on application performance. Unfortunately, the profiler won't tell you about the performance hit from the collector because it's not part of your direct application's performance.
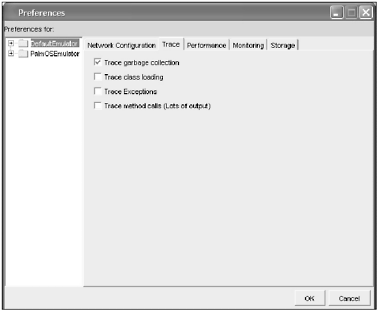
You can trace the operations of the garbage collector using the Trace Garbage Collection option in the default emulator preferences (see Figure 15.6).
Figure 15.6. Enabling the garbage collection tracer using the default emulator preferences
Once you've selected this option, run the game again, and you'll see output similar to the following lines:
Collected 1036 bytes of garbage (109096/204800 bytes free)
Garbage collecting...
Collected 616 bytes of garbage (109048/204800 bytes free)
Garbage collecting...
Collected 1048 bytes of garbage (108940/204800 bytes free)
Garbage collecting...
Collected 616 bytes of garbage (108892/204800 bytes free)
Execution completed successfully
26266550 bytecodes executed
3537 thread switches
339 classes in the system (including system classes)
4418 dynamic objects allocated (334808 bytes)
96 garbage collections (291608 bytes collected)
Total heap size 204800 bytes (currently 98080 bytes free)
If you watch this output as your game runs, you'll get a good idea of how often the garbage collector is running.